Know Your Enemy:
Statistics
Analyzing the past ... predicting the future
Honeynet Project
http://www.honeynet.org
Last Modified: 22 July, 2001
Over the past several years, the Honeynet Project has been collecting and archiving
information on blackhat activity. We have attempted, to the best of our ability,
to log and capture every probe, attack, and exploit made against our Honeynet. This
raw data has the potential for great value. We decided to share this data
with the security community and demonstrate its value. We will focus on two areas.
First, we intend to demonstrate how active the blackhat community can be.
Regardless of who you are, you are not safe. Our goal is to make you aware of this
threat. Second, to test the concept of Early Warning and Prediction. By identifying
trends and methods, it may be possible to predict an attack and react, days before
it happens. We test this theory using the data the Honeynet Project has collected.
The Collected Data
The Honeynet Project maintains an eight IP network that is highly controlled and
closely monitored. We collected and archived every attack on this network for a eleven
month period, specifically April 2000 to February 2001. This Honeynet consisted of eight
IP addresses, using a simple ISDN connection provided by a local ISP. This type
of connection is the same used by many homeowners or small business users. In fact, the
Honeynet was located in the spare bedroom of one of the Project members. During that time
period, there normally existed one to three systems within the Honeynet. These honeypots
ran one of the following operating systems; Solaris Sparc, WinNT, Win98, and Linux Red Hat.
The Honeynet network, the network
used to capture data,
is a basic network of commonly used operating systems, such as Red Hat Linux or Windows NT,
in a default configuration. No attempts were made to broadcast the identity of the Honeynet,
nor was any attempt made to lure attackers. Theoretically this site should see very little
activity, as we do not advertise any services nor the systems. However, attack they do, and
frequently.
What makes Honeynet data even more valuable is the reduction of both false positives and false
negatives, both common problems of many organizations. False positives are when organizations
are alerted to malicious activity, when in fact there is nothing going wrong. When
organizations are repeatedly hit with false positives, they begin to ignore their alerting
systems and the data it collects, making the systems potentially useless. For example, an
Intrusion Detection System mail alert administrators that a system is under attack, perhaps
a commonly known exploit was detected. However, this alert could have been mistakenly set off
by a user's email that contains a warning about known exploits, and includes the source code
for the attack to inform security administrators. Or perhaps network monitoring traffic such
as SNMP or ICMP had mistakenly set off alerting mechanisms. False positives are a constant
challenge for most organizations. Honeynets reduce this problem by not having any true
production traffic. A Honeynet is a network that has no real purpose, other then to capture
unauthorized activity. This means any packet entering or leaving a Honeynet is suspect by
nature. This simplifies the data capture and analysis process, reducing false positives.
False negatives are another challenge most organizations face. False negatives is the failure
to detect a truly malicious attack or unauthorized activity. Most organizations have mechanisms
in place to detect attacks, such as Intrusion Detection System, Firewall logs, System logs, and
process accounting. The purpose of these tools are to detect suspicious or unauthorized activity.
However, there are two major challenges leading to false negatives, data overload and new threats.
Data overload is when organizations capture so much data, not all of it can be reviewed, so
attacks are missed. For example, many organizations log Gigabytes of firewall or system activity.
It is extremely difficult to review all of this information and identify suspect behavior.
The second challenge is new attacks, threats that organizations or security software is not aware
of. If the attack is unknown, how can it be detected? The Honeynet reduces false negatives
(the missing of attacks) by capturing absolutely everything that enters and leaves the Honeynet.
Remember, there is little or no production activity within a Honeynet. This means all the activity
that is captured is most likely suspect. Even if we miss the initial attack, we still captured
the activity. For example, twice a honeypot has been compromised without Honeynet administrators
alerted in real time. We did not detect the successful attack until the honeypots initiated
outbound connections. Once these attempts were detected, we reviewed all of the captured activity,
identified the attack, how it was successful, and why we missed it. For research purposes,
Honeynets help reduce false negatives.
The value of the data you are about to review is that both false negatives and false positives
have been dramatically reduced. Keep in mind, the findings we discuss below are specific to
our network, this does not mean your organization will see the same traffic patterns or behavior.
We use this collected data to demonstrate the nature of certain blackhats, and the
potential for Early Warning and Prediction.
Analyzing the Past
While researching the blackhat community, the Honeynet Project has been astonished to
see just how active the blackhat community can be. The findings are scary. Below are
some of the statistics we have identified from the eleven month period of data we collected.
The purpose of these figures are to demonstrate the active behavior of the blackhat community.
Keep in mind, these statistics represent a home network of little value that was neither advertised
nor made any attempts to lure blackhats. Larger organizations that have great publicity or value
most likely are probed and attacked in far greater numbers.
Post attack analysis:
- Between April and December 2000, seven default installations of Red Hat 6.2 servers
were attacked within three days of connecting to the Internet. Based on this, we estimate
the life expectancy of a default installation of Red Hat 6.2 server to be less then 72 hours.
The last time we attempted to confirm this, the system was compromised in less than eight hours.
The fastest time ever for a system to be compromised was 15 minutes. This means the
system was scanned, probed, and exploited within 15 minutes of connecting to the Internet. Coincidentally,
this was the first honeypot we ever setup, in March of 1999.
- A default Windows98 desktop was installed on October 31, 2000, with sharing enabled, the same
configuration found in many homes and organizations. The honeypot was compromised in less than
twenty four hours. In the following three days it was successfully compromised another four times.
This makes a total of five successful attacks in less than four days.
- In May 2000, the first full month we archived Snort Intrusion Detection alerts, the Honeynet
recorded Snort 157 alerts. In February 2001, the Honeynet recorded 1,398 Snort alerts,
representing an increase of over 890%. This increase may be affected by modifications to
the Snort IDS configuration file. However, we also see an increase of activity in the Firewall logs.
In May 2000, the first full month we archived firewall alerts, the Honeynet firewall logged 103
unique scans (not counting NetBios). In February 2001, the Honeynet logged 206 unique scans
(not counting NetBios). This represents an increase of 100%. These numbers indicate blackhat
activity has continued to grow, most likely the result of more aggressive, automated scanning
tools and their growing availability.
- In a thirty day period (20 Sep - 20 Oct, 2000), the Honeynet received 524 UNIQUE NetBios scans,
averaging 17 unique NetBios scans every day.
- In the month of February, 2001, a total of 27 X86 exploits were launched against the Honeynet.
X86 means these attacks were designed for systems using the Intel based architecture. Of these, 8 were
launched against a Solaris Sparc system. These exploit attacks cannot work against the Sparc system,
as the system architecture is not compatible. This indicates that some blackhats are not bothering
to confirm what operating system nor what version of the service you are running. Some blackhats
have streamlined their scanning process to merely look for a specific service. If they find the service,
they launch the exploit without even first determining if the system
is vulnerable, or even the correct system. This active approach allows blackhats to scan and
exploit more systems in less time.
- From April 2000 through present, the most popular reconnaissance methods, besides general scanning,
was DNS version query, followed by queries to RPC services.
- The most popular attack method was an overflow associated with rpc.statd for Intel based systems.
- The most popular scanning method detected was the SYN-FIN scan to search the entire IP range for
specific ports (often in sequential order). This reflects the tactic of focusing on a single
vulnerability, and scanning as many systems as possible for the vulnerability. Many blackhats
only use a single tool or exploit that they know how to use, or is the most effective.
Predicting the Future
One of the areas the Honeynet intends to research is Early Warning and Prediction.
It is our intent to give more value to the data Honeynets collect by predicting future
attacks. This theory is not new and is being pursued by several outstanding organizations.
It is our hope that this research benefits and substantiates these and other organizations.
Before explaining our methodology, we would first like to state that our research is still
in its infancy, and requires more analysis.
Now, let's qualify that statement.
- We are talking about a single Honeynet, which offers the single sensor perspective, and
very small data set to work with. The methodology explained below will soon be tested in an
enterprise environment, with multiple Honeynets distributed around the world.
- We made no attempt to discern warnings by the same attacker, simply because of the widespread
use of spoofing.
- We currently work under an assumption that a machine is first probed and thereafter
attacked. Of course, the two events we tend to see may in fact be totally unrelated, mere
coincidence. Nonetheless, we performed the following analysis under the premise that
an attacker would have to, at the very minimum, gather intelligence prior to the attack, and
then check again just prior to the attack to see if the port was still open... which is what
we did see.
In an effort to predict trends, two members of the Honeynet Project took two different approaches.
However, their findings were the similar, almost all attacks could be detected two to three days
ahead of time.
Early warning using Statistical Process Controls (SPC):
The first was a very basic statistical analysis, similar to the statistical process control
methodology used in the manufacturing world to measure defects in
a factory setting. This method, although very simple, proved extremely accurate in providing
short-term (three days or less), warning notice of impending attacks on the Honeynet. The
basic process goes like this:
- We parsed snort logs from the period of April 2000 through January 2001.
- For each of the top ten snort rules reported on, we calculated the number of times each
rule was reported each day.
- Next, we calculated the three day moving average (3DMA) of each reported rule, and plotted
on a control chart the number of reports for each rule set each day, and the 3DMA.
- Control limits were calculated by obtaining the standard deviation of the average over
the period, and multiplying times 2 (2-sigma control limits).
- Any time the 3DMA were above the 2-sigma control limit, or if we noted a run (3 or more
increases with no decreases), we considered this a warning.
All calculations were performed without prior notice of attempted or successful attacks.
Only after the control chart was calculated, were attempted and successful attacks plotted
in the timelines. All data is available on the Honeynet site. Here are some of our findings:
- Honeynet recorded eight successful exploit attacks between April 9, 2000 and December 31, 2000.
During this time frame, every attack except one had prior warning indicators using the methodology
described above.
- For the entire timeline, and every attack noted, 3DMAs above the control limits gave 3 days
notice of each attempted attack in all times except one, which gave us 7 days notice. Simple
statistical process control techniques yielded a minimum of 3 days warning for each attack.
Here are some specific examples:
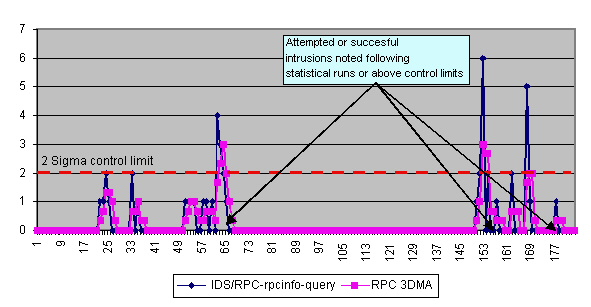
- RPC
: RPC activity was tracked over a 180 day period (day 1 begins on April 1, 2000,
the first day of the data set). Between days 61 through 68, the
3DMA showed a run, or upward movement in the control chart, indicating an abnormal amount of
activity. On day 68, an attempted access was noted using rpc.statd. Again, at day 153, and 170,
an abnormal amount of activity was noted at port 111, followed by a successful intrusion at day
177, using an rpc.statd overflow. Below is a graphical representation of this model, X-axis are the
days into the sample, Y-axis is the frequency.
- DNS/named
: Days 81-85 showed unusual activity above control limits, querying named
services. On day 85, named services were unsuccessfully attacked.
Validation through Regression Analysis and ARIMA:
The second methodology was used to validate the results of the first. We felt that
it would be a useful exercise to look at the relationship between snort rpc rule violations
and the number of days until system compromise. While a more proper time series model is in
order, a very quick and preliminary look can be had using a simple predictive regression
model regressing the frequency of a number of rpc rule violations on days until system
compromise.
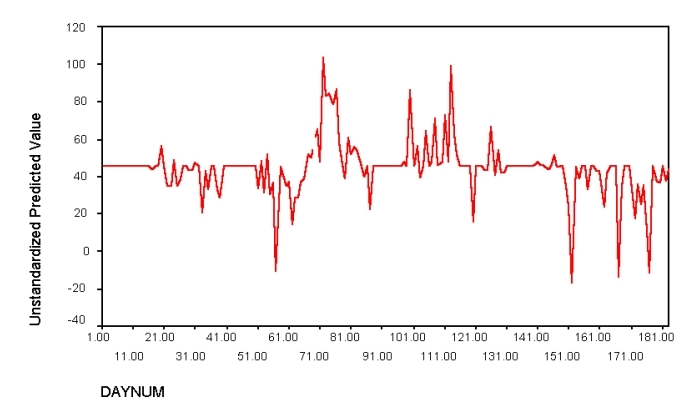
Figure 1 below reveals the predicted number of days until a system compromise with rpc.statd from
this model. The horizontal axis represents the date, in days during the sample time, from 1-180.
Downward spikes indicate significant activity, predicting an impending attack. This activity,
is visible about 10 days before the actual compromise occurs on day 68.
Again there are three downward "threat spikes" near the end of the chart before the system is again
compromised by the same rpc attack on day 177. We have not yet confirmed what the upward spikes are,
preliminary analysis suggests this is 'quiet time' or relatively safe periods.
While it should be cautioned that there are some statistical problems with the model - including a
large Durbin-Watson statistic suggesting that there is some serious auto correlation that needs to be
removed from the model - preliminary examination suggests that there are methods to warn of an
impending attack several days before it happens. A more sophisticated time series analysis of
this data in conjunction with other data would be most useful in further supporting the idea of early
warning.
Examining Characteristics of Pre-Attack Signals using an ARIMA Model
Another area of investigation is to discern the characteristics of certain types of attacks and probes.
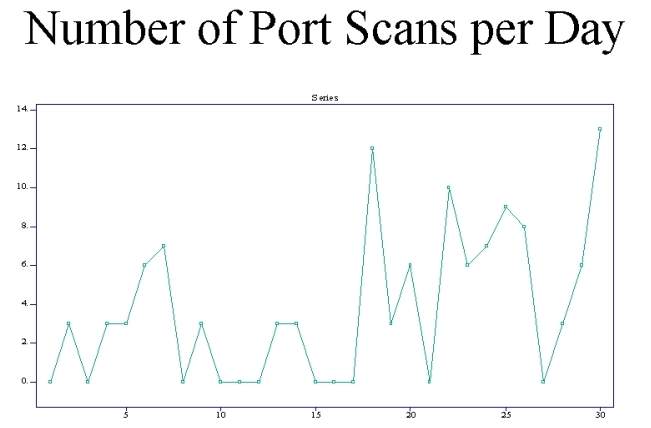
This second example comes from one of the Honeynet Team's "Scans of the Month". Graph below portrays
the number of port scans over a 30 day period. One of the questions we would like to answer is,
"What is the typical period of time within which either an attack, further probing or a cessation
of activities might be observed" for various probes and pre-attack behaviors. In this case a simple
time series ARIMA (Auto Regression Integrated with Moving Averages) model was fitted to the data. ARIMA
is a basic model used in time series analysis for looking at data collected over a period of time. The graph
below demonstrates the frequency of port scans for the month of November.

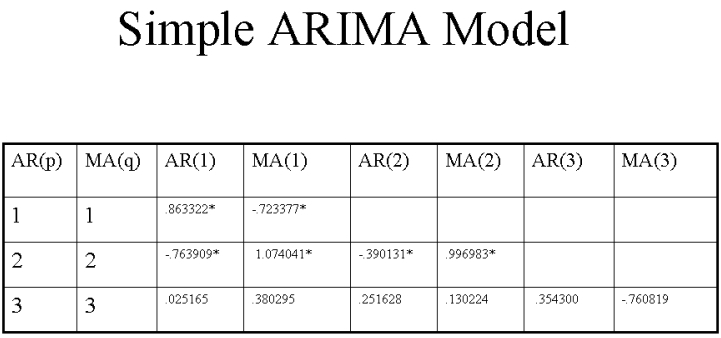
 The results of the ARIMA model appear in the table below. This table suggests that a port
scan session can typically last up to three days before it terminates and another phase of the
pre attack, the attack itself or cessation of "hostilities" ensues. It also suggests that the
3 day moving average suggested by our other team statistician may be too generous
and that a 2 day moving average process may better describe at least this type of attack.
The results of the ARIMA model appear in the table below. This table suggests that a port
scan session can typically last up to three days before it terminates and another phase of the
pre attack, the attack itself or cessation of "hostilities" ensues. It also suggests that the
3 day moving average suggested by our other team statistician may be too generous
and that a 2 day moving average process may better describe at least this type of attack.
 In both of these analyses it should be noted that they are conducted on very limited and small set
of data. However it suggests that analyses on larger sets of data may in fact bear non-trivial
fruit in helping to find statistical models that can create "threat alerts" of attacks in advance
of the attack itself. To further test and prove these theories, we intend on developing the following:
In both of these analyses it should be noted that they are conducted on very limited and small set
of data. However it suggests that analyses on larger sets of data may in fact bear non-trivial
fruit in helping to find statistical models that can create "threat alerts" of attacks in advance
of the attack itself. To further test and prove these theories, we intend on developing the following:
- We need to acquire more and better data to get a good idea of patterns and relationships
- More variables, adding other types of snort captures will help us better understand
the processes occurring.
- Different analysis techniques like Event History Analysis
We encourage the security community to test and develop these theories and perform
their own statistical analysis. We are especially interested in any other types of
analysis or finding people may find. What we have presented here is by no means an
exhaustive analysis, rather this represents preliminary research. Linked below
is the data collected and used by the Honeynet Project. This data represent eleven
months of data, collected from April, 2000 to February, 2001.
honeynet_data.tar.gz
Conclusion
During an eleven month period the Honeynet Project attempted to collect every probe, attack,
and exploit sent against it. This data was then analyzed with two goals in mind. The
first goal was to demonstrate just how active the blackhat community can be. The numbers
demonstrate the hostile threat we all face. Remember, the Honeynet used to
collect this information had no production systems of value, nor was it advertised to lure
attackers. If your organization has any value, or is advertised in any way, you are most likely
exposed to even greater threat. The second goal was to test the theory of
Early Warning and Prediction. We feel there is potential in predicting future attacks.
Honeynets are by no means the only method to collect such data, however they have the advantage
of reducing both false positives and false negatives. Armed with data collection and statistical
analysis, there is the potential for organizations to be better prepared against the blackhat community.
