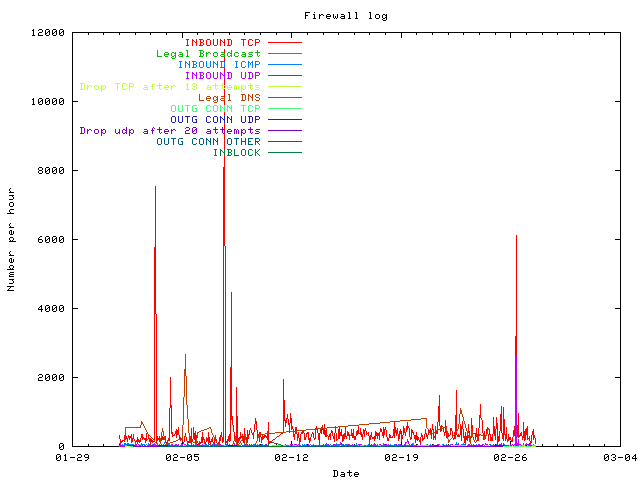
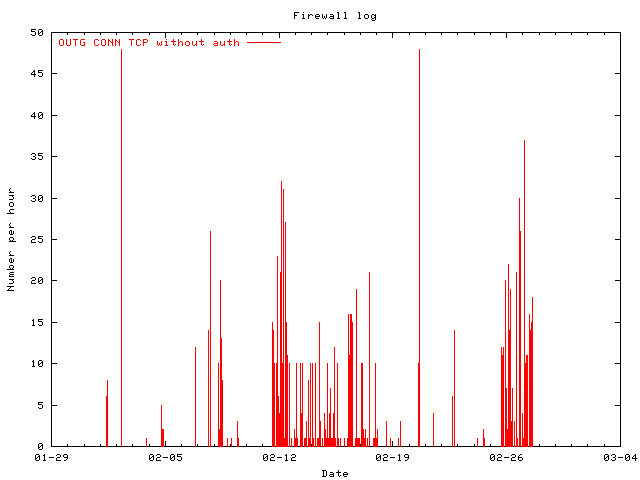
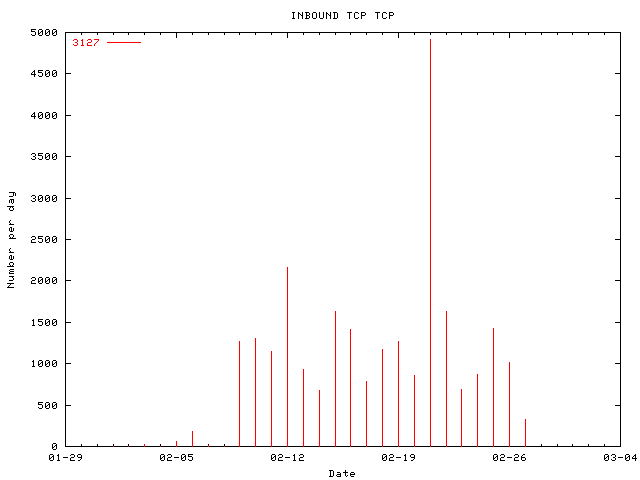
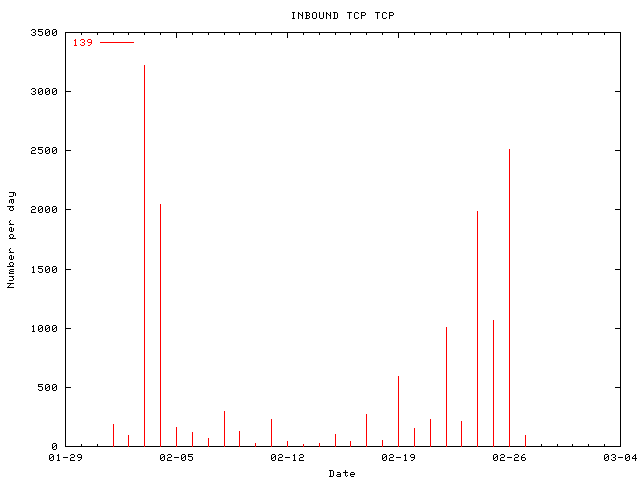
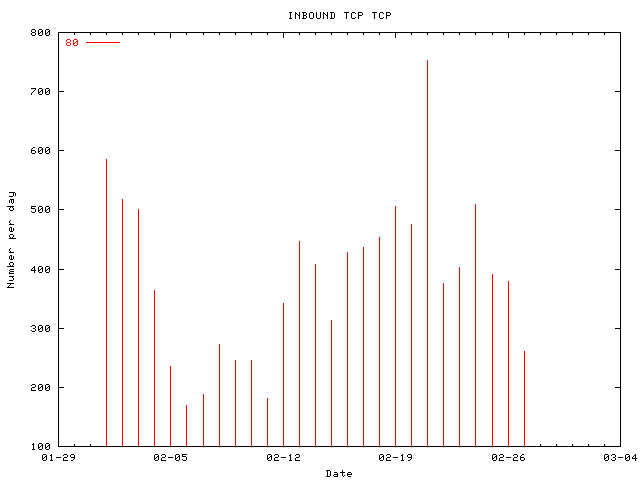
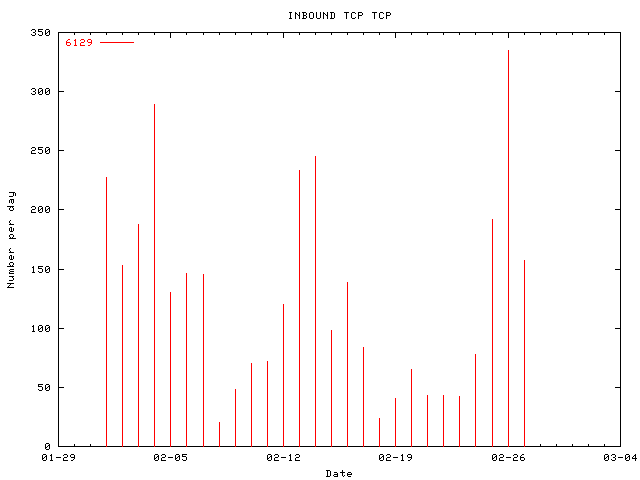
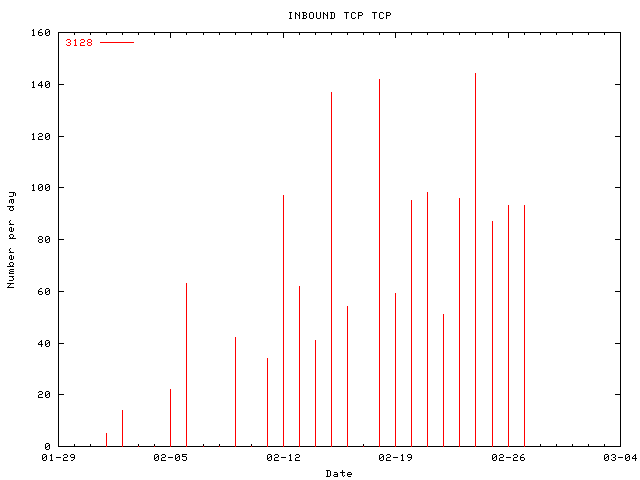
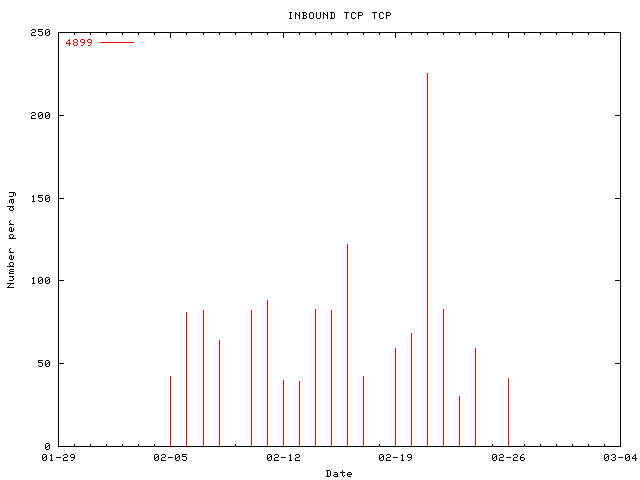
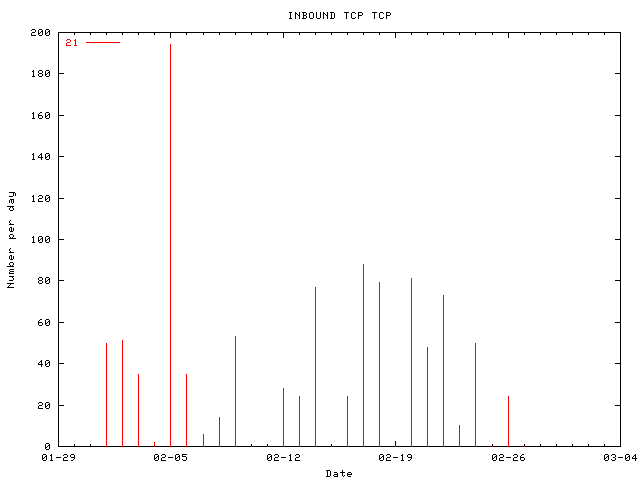
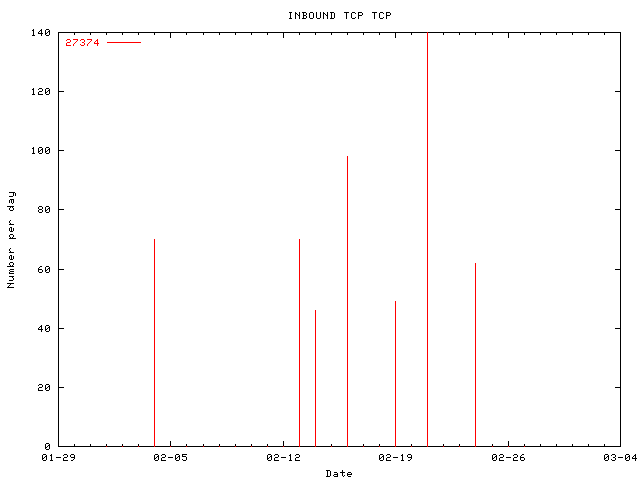
There are some burst of activity, no trivial general growing or decreasing trend.
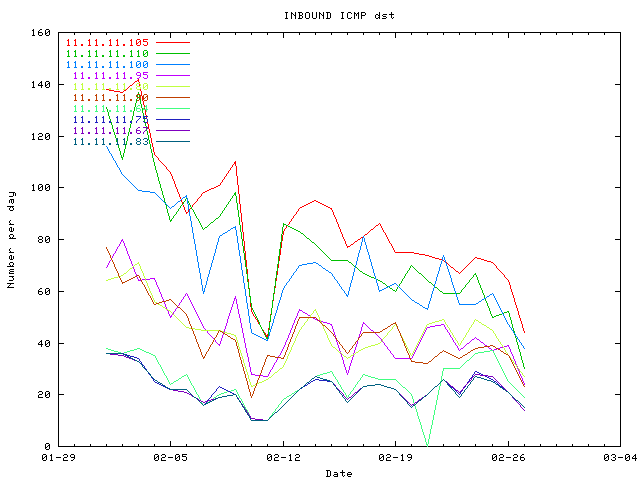
INBOUND ICMP is decreasing with time.
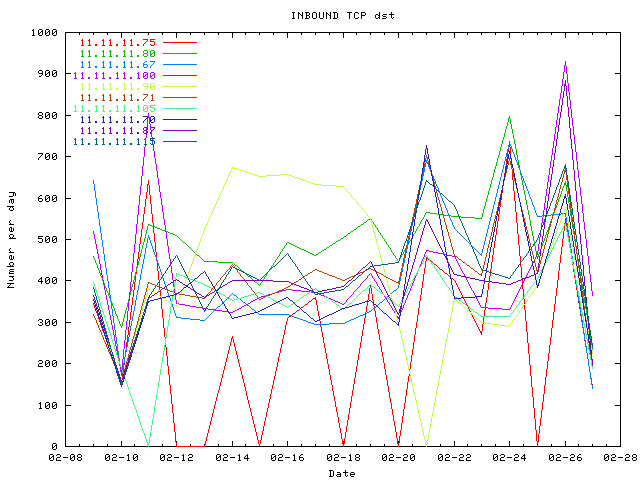
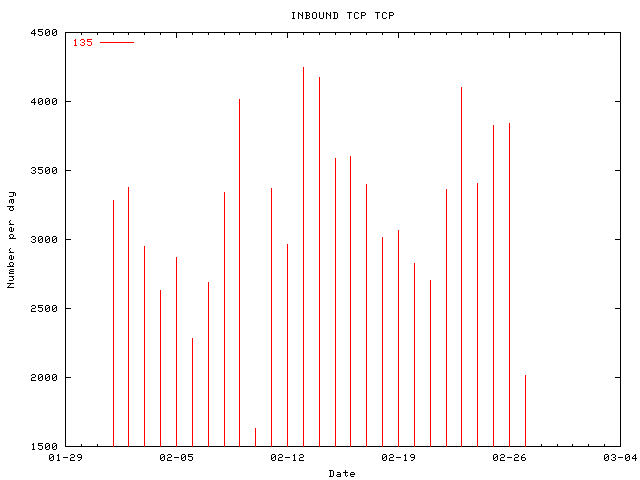
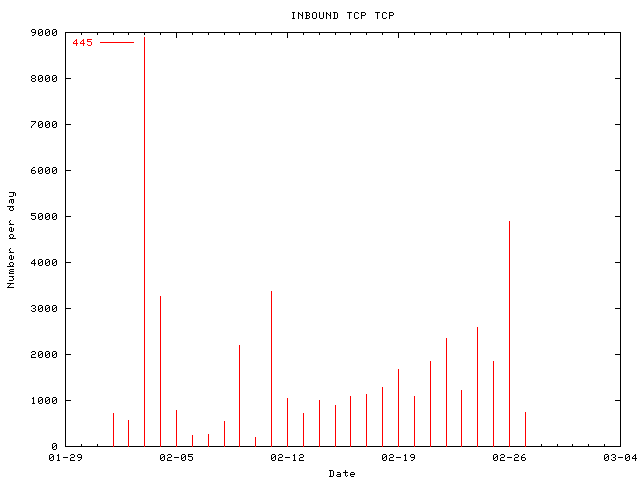
INBOUND TCP is increasing.
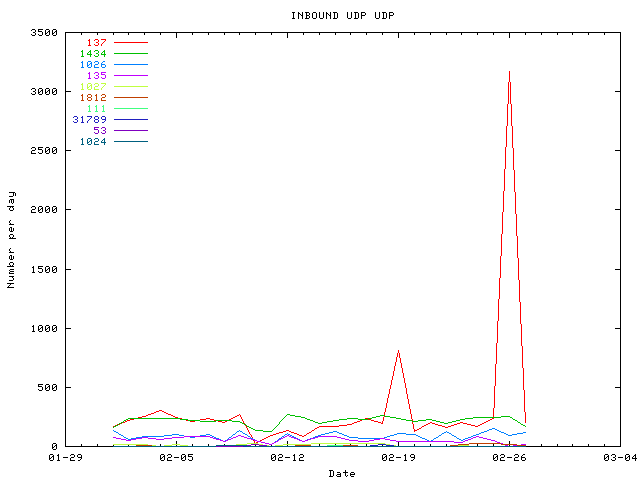
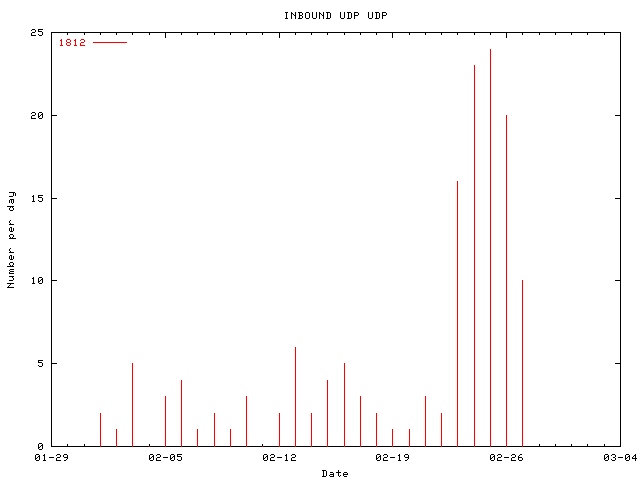
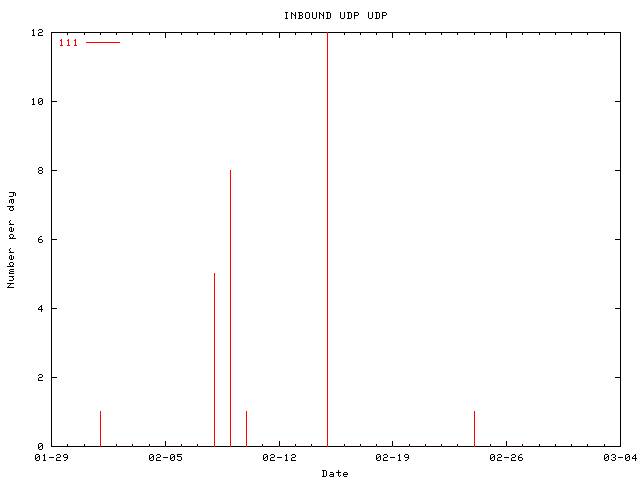
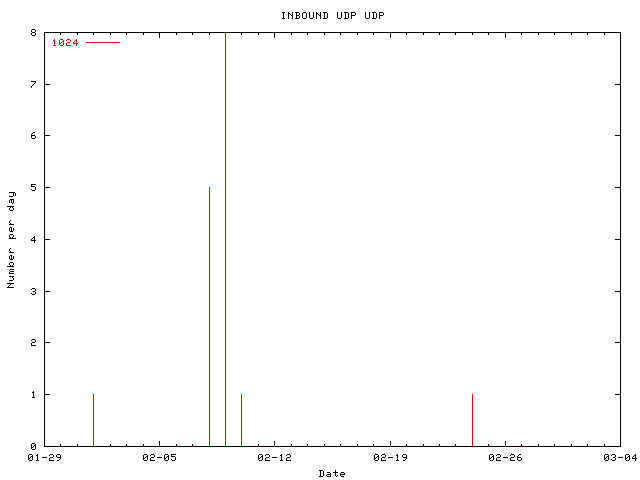
INBOUND UDP is rather stable.
The job is to analyze a month's worth of honeynet IPtable firewall logs captured in the wild. All sorts of fun stuff happening, including several compromises.
Data file can be downloaded from Honeynet web site.
[kmaster@christophe sotm30]$ md5sum honeynet-Feb1_FebXX.log*
8c0070ef51f6f764fde0551fa60da11b  honeynet-Feb1_FebXX.log
e002b1013f18dd42e17be919c2870081  honeynet-Feb1_FebXX.log.gz
[kmaster@christophe sotm30]$ head -1 honeynet-Feb1_FebXX.log
Feb  1 00:00:02 bridge kernel: INBOUND TCP: IN=br0 PHYSIN=eth0 OUT=br0 PHYSOUT=eth1 SRC=192.150.249.87 DST=11.11.11.84 LEN=40 TOS=0x00 PREC=0x00 TTL=110 ID=12973 PROTO=TCP SPT=220 DPT=6129 WINDOW=16384 RES=0x00 SYN URGP=0
[kmaster@christophe sotm30]$ tail -1 honeynet-Feb1_FebXX.log
Feb 27 14:40:06 bridge kernel: OUTG CONN TCP: IN=br0 PHYSIN=eth1 OUT=br0 PHYSOUT=eth0 SRC=11.11.11.71 DST=220.210.69.62 LEN=40 TOS=0x00 PREC=0x00 TTL=64 ID=50688 DF PROTO=TCP SPT=80 DPT=1325 WINDOW=6432 RES=0x00 ACK URGP=0
The logs have been captured between Feb 1 00:00:02 and Feb 27 14:40:06. Nothing has been log between Feb 10 14:47:18 and Feb 11 10:03:32.
Feb 10 13:51:02 bridge kernel: eth0: 0 multicast blocks dropped.
Feb 10 13:51:03 bridge kernel: br0: port 2(eth0) entering disabled state
Feb 10 13:51:03 bridge kernel: eth1: 0 multicast blocks dropped.
Feb 10 13:51:03 bridge kernel: br0: port 1(eth1) entering disabled state
Feb 10 13:51:05 bridge kernel: br0: port 2(eth0) entering listening state
Feb 10 13:51:20 bridge kernel: br0: port 2(eth0) entering learning state
Feb 10 13:51:35 bridge kernel: br0: port 2(eth0) entering forwarding state
Feb 10 13:51:35 bridge kernel: br0: topology change detected, propagating
Feb 10 13:52:24 bridge kernel: br0: port 2(eth0) entering disabled state
Feb 10 13:52:24 bridge kernel: device eth0 left promiscuous mode
Feb 10 13:52:24 bridge kernel: br0: port 1(eth1) entering disabled state
Feb 10 13:52:24 bridge kernel: device eth1 left promiscuous mode
...
Feb 10 14:47:18 bridge kernel: INBLOCK: IN=eth1 OUT= MAC=ff:ff:ff:ff:ff:ff:00:b0:d0:87:85:c3:08:00 SRC=11.11.11.69 DST=11.11.11.255 LEN=241 TOS=0x00 PREC=0x00 TTL=64 ID=0 DF PROTO=UDP SPT=138 DPT=138 LEN=221
Feb 11 10:03:32 bridge kernel: INBLOCK: IN=eth1 OUT= MAC=ff:ff:ff:ff:ff:ff:00:b0:d0:87:85:c3:08:00 SRC=11.11.11.67 DST=11.11.11.255 LEN=96 TOS=0x00 PREC=0x00 TTL=64 ID=0 DF PROTO=UDP SPT=137 DPT=137 LEN=76
...
Feb 11 11:03:07 bridge kernel: device eth1 entered promiscuous mode
Feb 11 11:03:07 bridge kernel: device eth0 entered promiscuous mode
Feb 11 11:03:07 bridge kernel: br0: port 2(eth0) entering listening state
Feb 11 11:03:07 bridge kernel: br0: port 1(eth1) entering listening state
Feb 11 11:03:22 bridge kernel: br0: port 2(eth0) entering learning state
Feb 11 11:03:22 bridge kernel: br0: port 1(eth1) entering learning state
Feb 11 11:03:31 bridge kernel: Kernel logging (proc) stopped.
Feb 11 11:03:31 bridge kernel: Kernel log daemon terminating.
Feb 11 11:08:38 bridge kernel: INBOUND TCP: IN=br0 PHYSIN=eth0 OUT=br0 PHYSOUT=eth1 SRC=63.204.248.182 DST=11.11.11.90 LEN=48 TOS=0x00 PREC=0x00 TTL=113 ID=23614 DF PROTO=TCP SPT=3961 DPT=135 WINDOW=64800 RES=0x00 SYN URGP=0
All records are from the host bridge. It seems to be a
GenII (layer2 bridging)
honeynet with on eth0 the production network and on eth1 the honeypots.
| IP | Drop TCP after 13 attempts | Drop udp after 20 attempts | INBLOCK | INBOUND ICMP | INBOUND TCP | INBOUND UDP | Legal Broadcast | Legal DNS | OUTG CONN OTHER | OUTG CONN TCP | OUTG CONN UDP | Total |
|---|---|---|---|---|---|---|---|---|---|---|---|---|
| 11.11.11.64 | 0 | 0 | 0 | 687 | 4420 | 652 | 0 | 0 | 0 | 0 | 0 | 5759 |
| 11.11.11.65 | 0 | 4 | 129 | 0 | 0 | 0 | 0 | 0 | 0 | 0 | 135 | 268 |
| 11.11.11.67 | 20 | 7 | 34 | 600 | 11387 | 994 | 3792 | 18107 | 7 | 370 | 485 | 35803 |
| 11.11.11.69 | 0 | 0 | 151 | 597 | 9715 | 795 | 0 | 0 | 0 | 42 | 0 | 11300 |
| 11.11.11.70 | 0 | 0 | 0 | 597 | 9884 | 805 | 0 | 0 | 0 | 0 | 0 | 11286 |
| 11.11.11.71 | 4 | 0 | 0 | 591 | 10248 | 814 | 0 | 0 | 0 | 676 | 0 | 12333 |
| 11.11.11.72 | 0 | 0 | 0 | 594 | 9298 | 880 | 0 | 0 | 0 | 51 | 0 | 10823 |
| 11.11.11.73 | 2 | 0 | 0 | 593 | 9518 | 804 | 0 | 0 | 0 | 76 | 0 | 10993 |
| 11.11.11.75 | 1 | 0 | 0 | 600 | 29301 | 829 | 0 | 0 | 0 | 97 | 0 | 30828 |
| 11.11.11.80 | 11 | 0 | 0 | 1190 | 12435 | 820 | 0 | 0 | 0 | 427 | 0 | 14883 |
| 11.11.11.81 | 0 | 0 | 0 | 593 | 8972 | 833 | 0 | 0 | 0 | 0 | 0 | 10398 |
| 11.11.11.82 | 0 | 0 | 0 | 594 | 9217 | 845 | 0 | 0 | 0 | 0 | 0 | 10656 |
| 11.11.11.83 | 0 | 0 | 0 | 594 | 8570 | 847 | 0 | 0 | 0 | 0 | 0 | 10011 |
| 11.11.11.84 | 0 | 0 | 0 | 584 | 7767 | 806 | 0 | 0 | 0 | 0 | 0 | 9157 |
| 11.11.11.85 | 0 | 0 | 0 | 590 | 8506 | 800 | 0 | 0 | 0 | 0 | 0 | 9896 |
| 11.11.11.87 | 0 | 0 | 0 | 585 | 10101 | 893 | 0 | 0 | 0 | 0 | 0 | 11579 |
| 11.11.11.89 | 0 | 0 | 0 | 582 | 8558 | 766 | 0 | 0 | 0 | 0 | 0 | 9906 |
| 11.11.11.90 | 0 | 0 | 0 | 1164 | 10596 | 763 | 0 | 0 | 0 | 0 | 0 | 12523 |
| 11.11.11.95 | 0 | 0 | 0 | 1230 | 8109 | 830 | 0 | 0 | 0 | 0 | 0 | 10169 |
| 11.11.11.100 | 0 | 0 | 1 | 1886 | 10645 | 772 | 0 | 0 | 0 | 0 | 0 | 13304 |
| 11.11.11.105 | 0 | 0 | 1 | 2350 | 10167 | 748 | 0 | 0 | 0 | 0 | 0 | 13266 |
| 11.11.11.110 | 0 | 0 | 0 | 2070 | 10181 | 658 | 0 | 0 | 0 | 0 | 0 | 12909 |
| 11.11.11.115 | 0 | 0 | 0 | 246 | 10161 | 681 | 0 | 0 | 0 | 0 | 0 | 11088 |
| 11.11.11.120 | 0 | 0 | 0 | 242 | 7449 | 673 | 0 | 0 | 0 | 0 | 0 | 8364 |
| 11.11.11.125 | 0 | 0 | 0 | 243 | 9341 | 686 | 0 | 0 | 0 | 0 | 0 | 10270 |
| 11.11.11.255 | 0 | 0 | 56 | 0 | 0 | 0 | 3792 | 0 | 0 | 0 | 0 | 3848 |
Honeynet IPs have been sanitized to 11.11.11.* and
DNS server IPs to 22.22.22.* and 23.23.23.*
In this table, we can find the honeypots and the production machine.
11.11.11.75, 11.11.11.80 and 11.11.11.67 have the most inbound traffic, they
are the most attacked.
11.11.11.65 seems to be the bridge and hosting a syslog server.
Feb 10 14:03:35 bridge kernel: INBLOCK: IN=eth1 OUT= MAC=00:02:b3:65:c9:71:00:b0:d0:87:85:c3:08:00 SRC=11.11.11.69 DST=11.11.11.65 LEN=65 TOS=0x00 PREC=0x00 TTL=64 ID=0 DF PROTO=UDP SPT=1025 DPT=514 LEN=45
Only 11.11.11.67 is doing DNS resolution! There are two possibilities:
[kmaster@christophe sotm30_bis]$ grep MAC= honeynet-Feb1_FebXX.log|cut -d= -f 3-6|sort -u
 MAC=00:02:b3:65:c9:71:00:b0:d0:87:85:c3:08:00 SRC=11.11.11.67 DST=11.11.11.65 LEN
 MAC=00:02:b3:65:c9:71:00:b0:d0:87:85:c3:08:00 SRC=11.11.11.69 DST=11.11.11.65 LEN
 MAC=ff:ff:ff:ff:ff:ff:00:b0:d0:87:85:c3:08:00 SRC=11.11.11.67 DST=11.11.11.255 LEN
 MAC=ff:ff:ff:ff:ff:ff:00:b0:d0:87:85:c3:08:00 SRC=11.11.11.69 DST=11.11.11.255 LEN
Looking for MAC address, it is possible to find that
| 00:02:b3:65:c9:71 | 11.11.11.65 |
| b0:d0:87:85:c3:08 | 11.11.11.67, 11.11.11.69 |
Let's check if IP aliasing is used. The most frequent destination in outgoing TCP is the host 195.36.244.104. If you check the logs, you will see a strong correlation between SRC and DPT (SRC=11.11.11.x DPT=3356-69+x):
grep "DST=195.36.244.104" honeynet-Feb1_FebXX.log > 195.36.244.104
grep "SPT=21" 195.36.244.104|cut -d= -f5-|cut -d' ' -f2,12|sort -u
SRC=11.11.11.69 DPT=3356
SRC=11.11.11.71 DPT=3358
SRC=11.11.11.72 DPT=3359
SRC=11.11.11.73 DPT=3360
SRC=11.11.11.75 DPT=3362
SRC=11.11.11.80 DPT=3367
IP aliasing on the honeypot is used! Netfilter limit module is also used on the firewall in combination with the LOG target to give limited logging.
Looking for TCP with ACK SYN flags, you can learn open TCP ports
on remote servers. To find open TCP
ports on honeypot, we need to search outgoing TCP connexion logs without SYN, nor RST.
By reading a grep output of OUTG CONN UDP, we learn that 11.11.11.67
have UDP 137 opened. Full listing is avaible here.
| 11.11.11.67 | TCP | 80(http) |
| 139(netbios-ssn) | ||
| 443(https) | ||
| UDP | 137(netbios-ns) | |
| 11.11.11.69 | TCP | 21(ftp) |
| 80(http) | ||
| 443(https) | ||
| 11.11.11.71 | TCP | 21(ftp) |
| 80(http) | ||
| 443(https) | ||
| 11.11.11.72 | TCP | 21(ftp) |
| 80(http) | ||
| 443(https) | ||
| 11.11.11.73 | TCP | 21(ftp) |
| 80(http) | ||
| 139(netbios-ssn) | ||
| 443(https) | ||
| 3128(squid) | ||
| 11.11.11.75 | TCP | 21(ftp) |
| 80(http) | ||
| 443(https) | ||
| 11.11.11.80 | TCP | 21(ftp) |
| 80(http) | ||
| 139(netbios-ssn) | ||
| 443(https) |
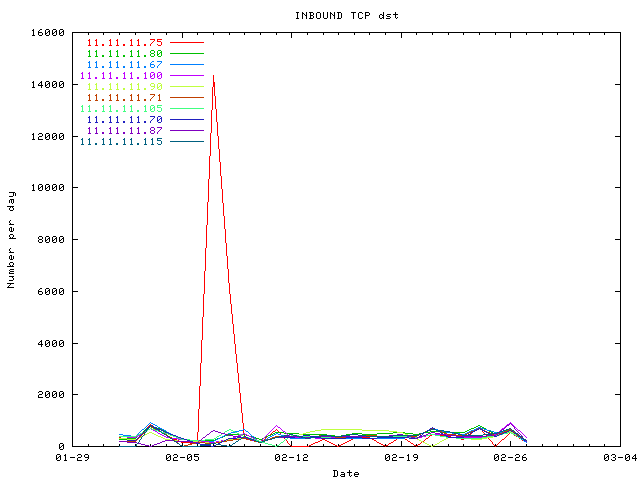
Let's consider the quantity of logs for each IP. 11.11.11.75, 11.11.11.80 and 11.11.11.67 have the most inbound traffic, they are the most attacked.
[kmaster@christophe sotm30_bis]$ grep ICMP honeynet-Feb1_FebXX.log| ./stat_len.pl
LEN=28 count=100	Nmap ping (No data)
LEN=32 count=1
LEN=36 count=42
LEN=37 count=146
LEN=38 count=0		Linux Traceroute -I
LEN=52 count=48
LEN=60 count=979	W2K ping, Cisco PIX ping
LEN=64 count=123
LEN=84 count=4		Linux 2.4 ping
LEN=92 count=18140	Nachi/Welchia worm, W2K traceroute
LEN=96 count=7
LEN=100 count=14	Cisco Catalyst ping
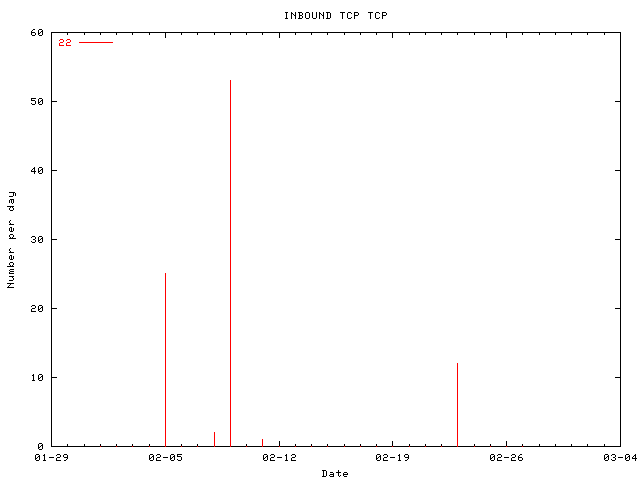
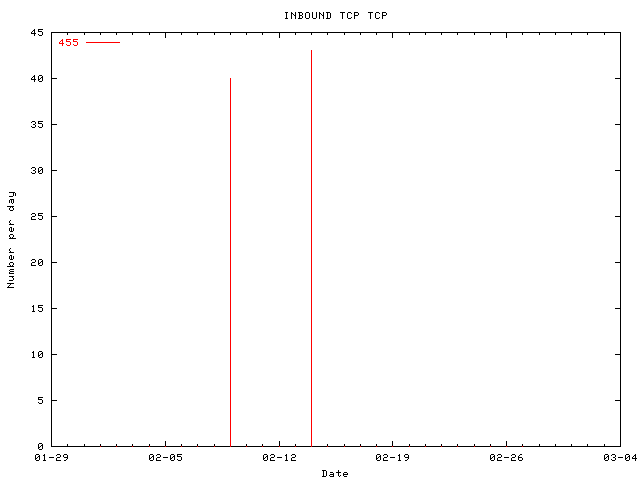
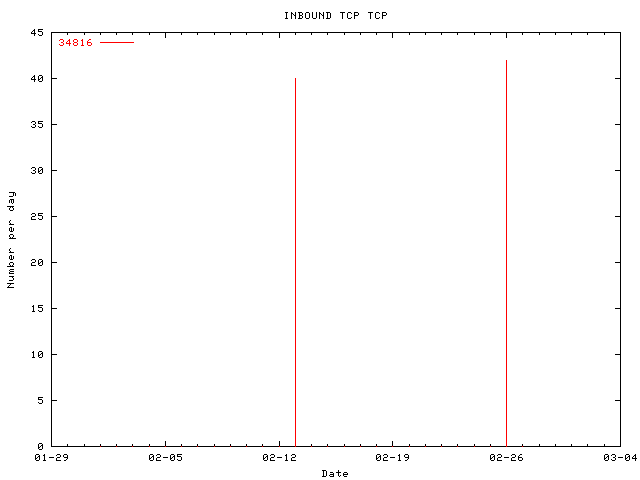
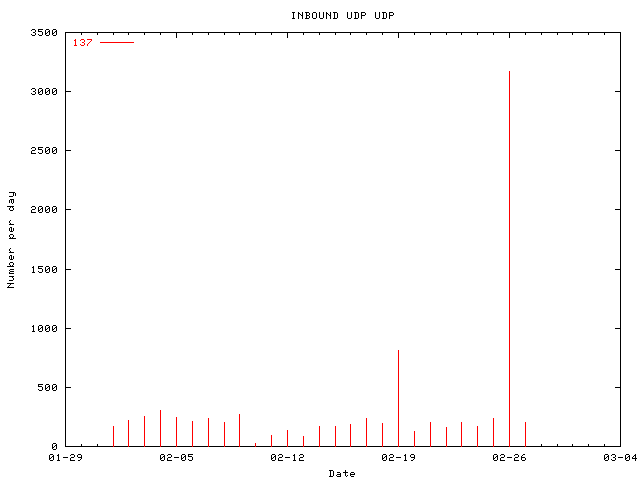
There are some burst of activity, no trivial general growing or decreasing trend.
INBOUND ICMP is decreasing with time.
INBOUND TCP is increasing.
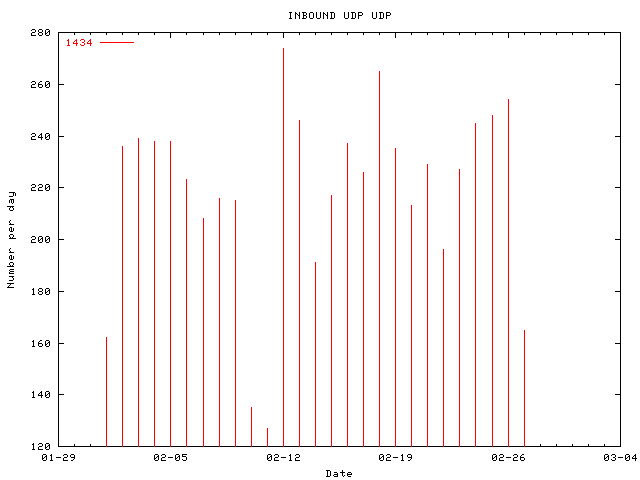
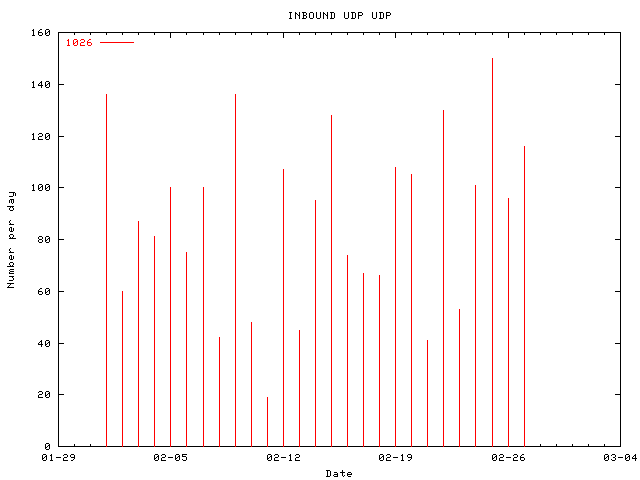
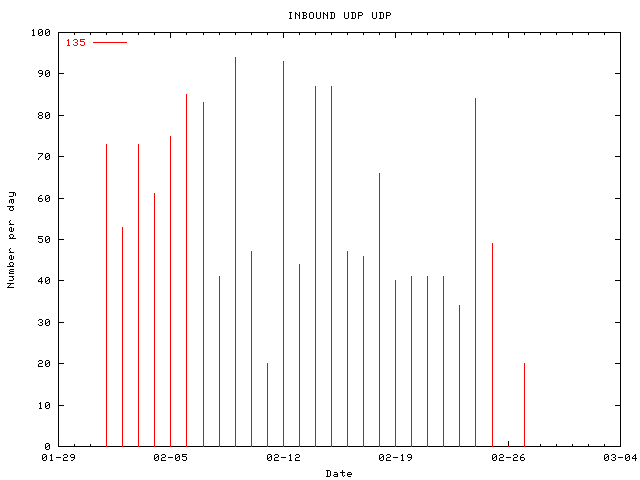
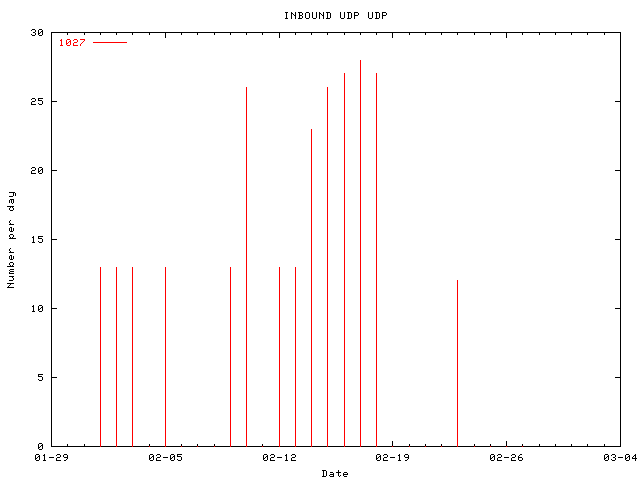
INBOUND UDP is rather stable.
There are some outgoing connections other than ident/auth and DNS requests because the Honeypot have been hacked as it will be explained latter.
Most attacked ports are similar between what can be observed and DShield TOP Ports.
Trends has been calculated using the formula given on http://isc.incidents.org/trends.html, but as data volume is low, the relative error can be important.
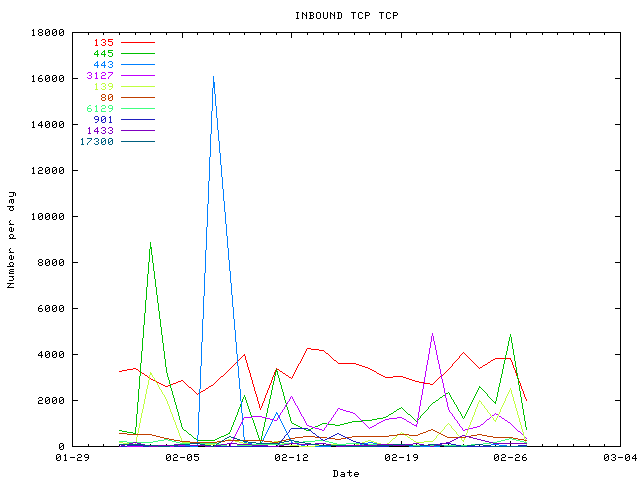
| 135 | 86565 | Timeline Trend: -0.12 | DCE endpoint resolution, Microsoft RPC services CAN-2003-0605 CAN-2003-0528 CAN-2003-0352 |
| 445(microsoft-ds) | 46433 | Timeline Trend: 0.47 | Win2k+ Server Message Block |
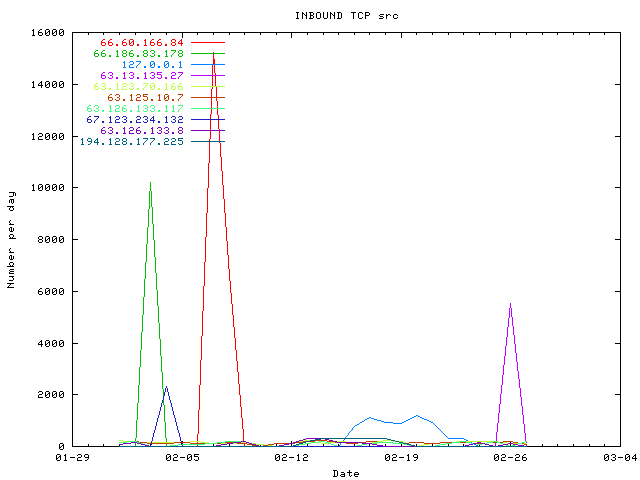
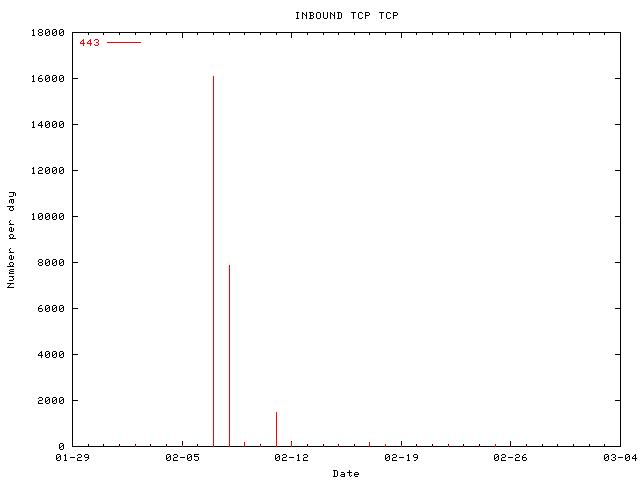
| 443(https) | 26316 | Timeline Trend: -19.11 | Secure HTTP, 66.60.166.84 is sending a lot of packet to 11.11.11.75 (to other IP too) over HTTPS (TCP 443) around Feb 7,17h. |
| 3127 | 25781 | Timeline Trend: -0.37 | W32/MyDoom, W32.Novarg.A backdoor |
| 139(netbios-ssn) | 14980 | Timeline Trend: 0.83 | |
| 80(http) | 10384 | Timeline Trend: -0.21 | HTTP |
| 6129 | 3427 | Timeline Trend: 0.64 | Dameware Remote Admin, an exploit is avaible: DameWare Mini Remote Control Server Local SYSTEM Exploit Vulnerable Versions Prior to 3.71.0.0 |
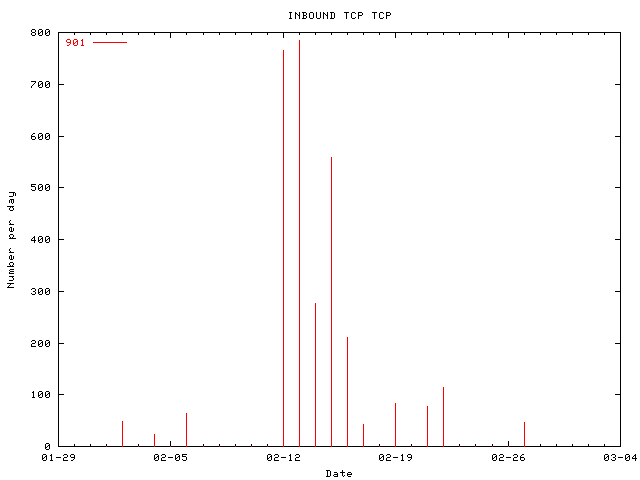
| 901(swat) | 3097 | Timeline Trend: -1.61 | Samba Web Administration Tool |
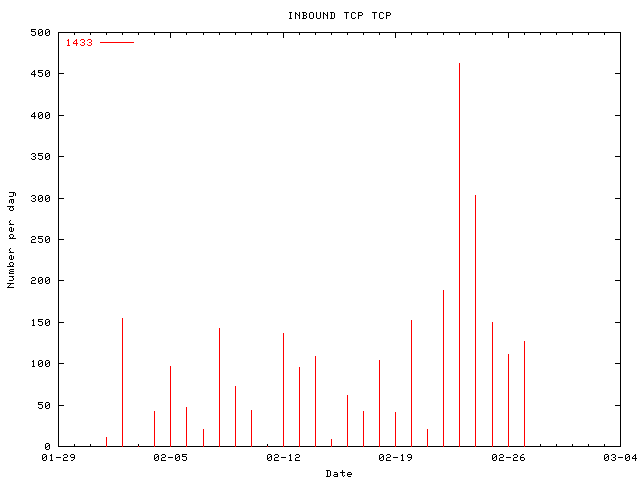
| 1433(ms-sql-s) | 2745 | Timeline Trend: 0.13 | Microsoft-SQL-Server |
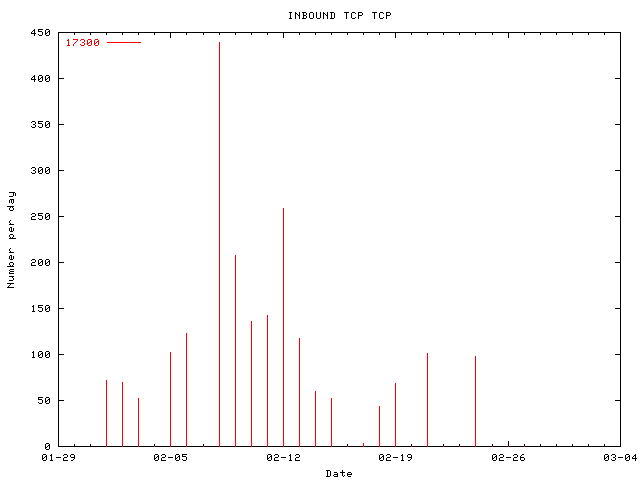
| 17300 | 2146 | Timeline Trend: -16.61 | Kuang2 backdoor |
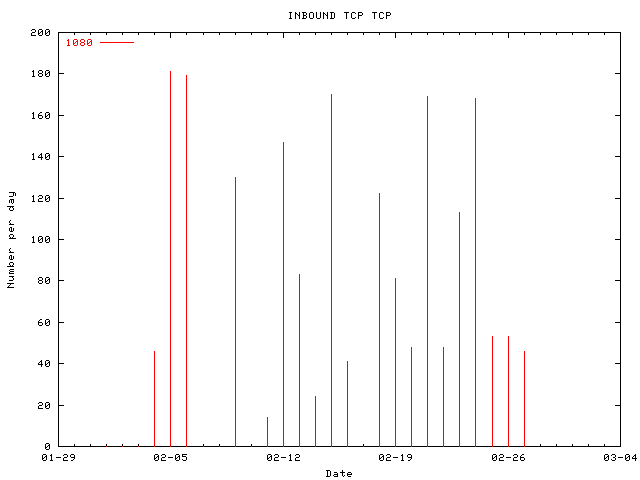
| 1080(socks) | 1916 | Timeline Trend: -0.39 | Proxy Server |
| 3128(squid) | 1529 | Timeline Trend: 0.47 | Proxy Server |
| 4899 | 1412 | Timeline Trend: -0.96 | Radmin (www.radmin.com) remote PC control software |
| 21(ftp) | 1046 | Timeline Trend: -1.20 | FTP |
| 27374(asp) | 535 | Timeline Trend: -15.22 | Subseven Windows trojan |
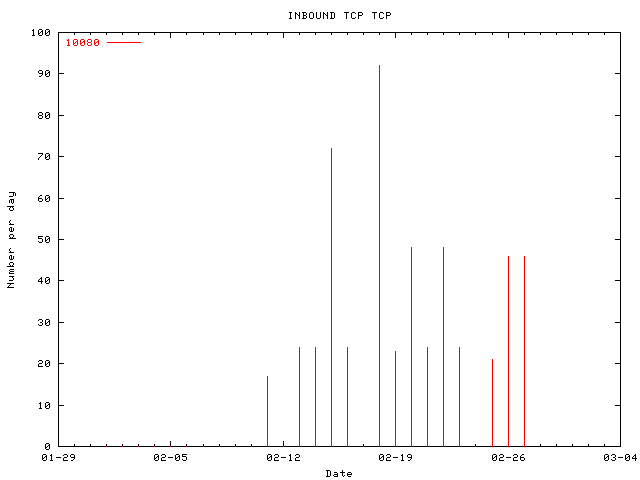
| 10080(amanda) | 533 | Timeline Trend: 0.82 | Amanda Backup Util, One of several ports MyDoom.B infected systems attempts to open. Infected systems may be detected by outbound TCP flows to port 3127 (possibly 3127-3198) or open TCP ports on {1080, 3128, 80, 8080, 10080} Tech alert from us-cert |
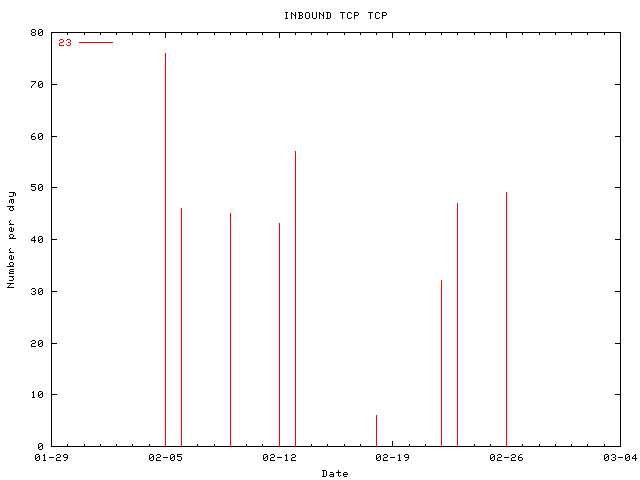
| 23(telnet) | 401 | Timeline Trend: 0.48 | Telnet |
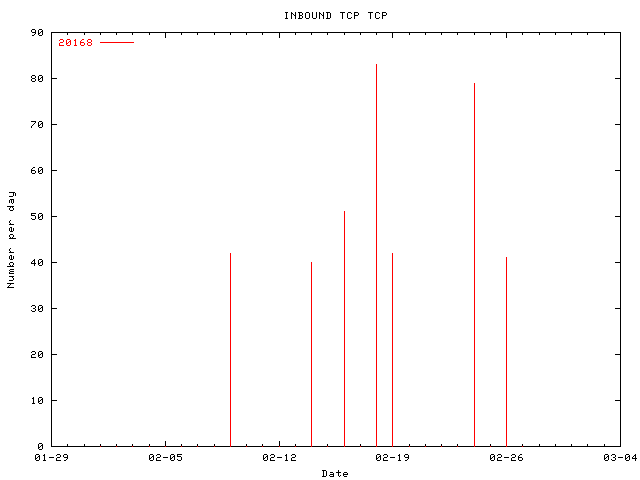
| 20168 | 378 | Timeline Trend: 0.36 | lovgate virus remote control |
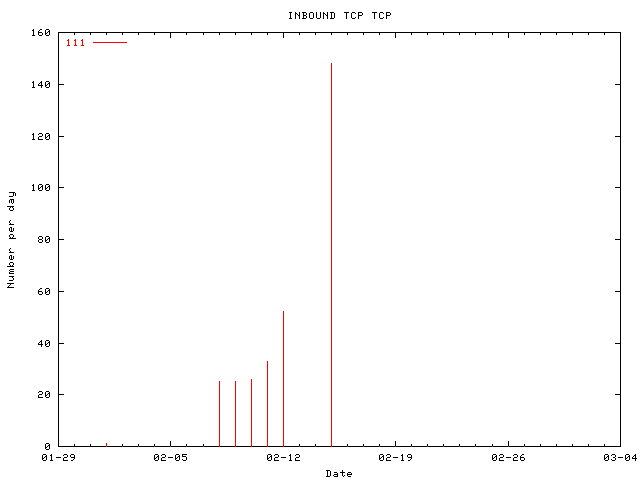
| 111(sunrpc) | 310 | Timeline Trend: -14.67 | Portmapper, rpcbind |
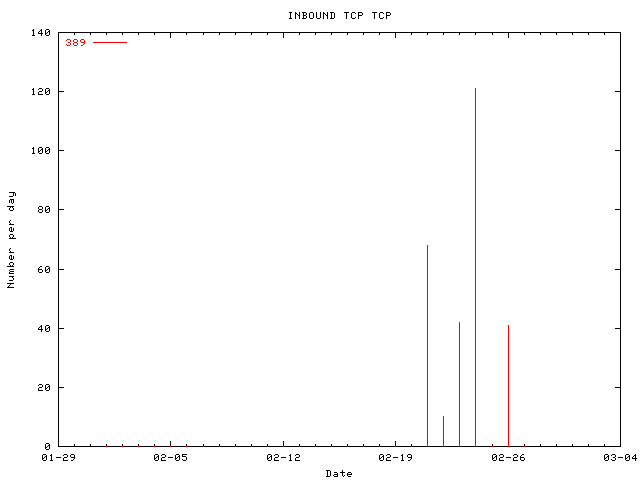
| 389(ldap) | 282 | Timeline Trend: 0.65 | Lightweight Directory Access Protocol |
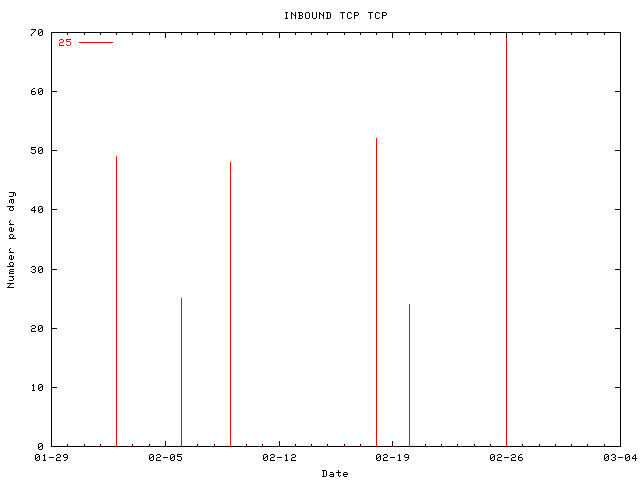
| 25(smtp) | 267 | Timeline Trend: 1.22 | Looking for SMTP open relay ? |
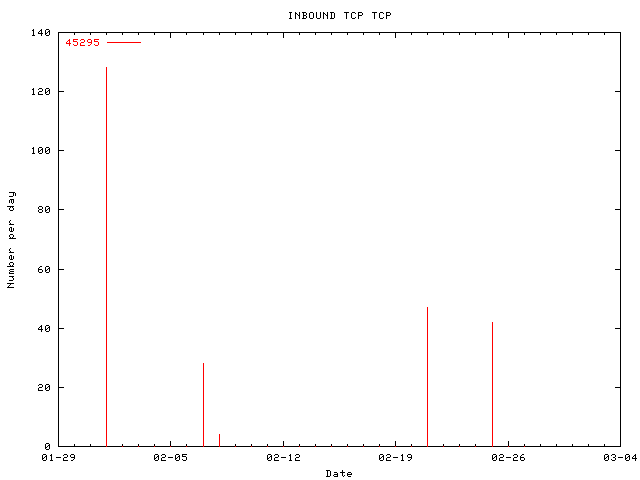
| 45295 | 249 | Timeline Trend: -14.45 | Firebird DB trojan |
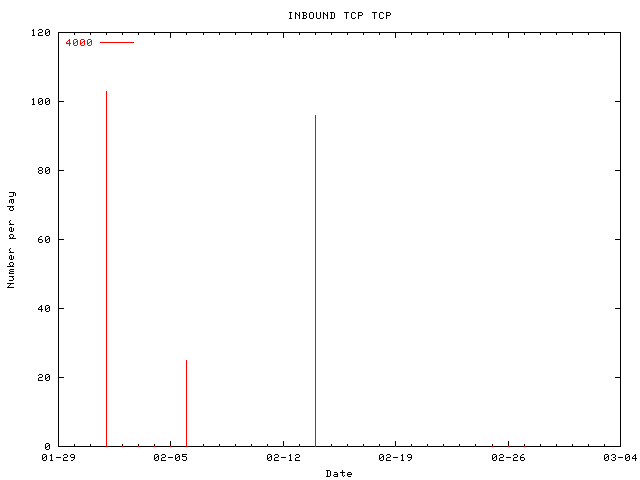
| 4000 | 224 | Timeline Trend: -14.35 | neoworx remote-anything slave remote control AOL ICQ instant messaging clent-server communication |
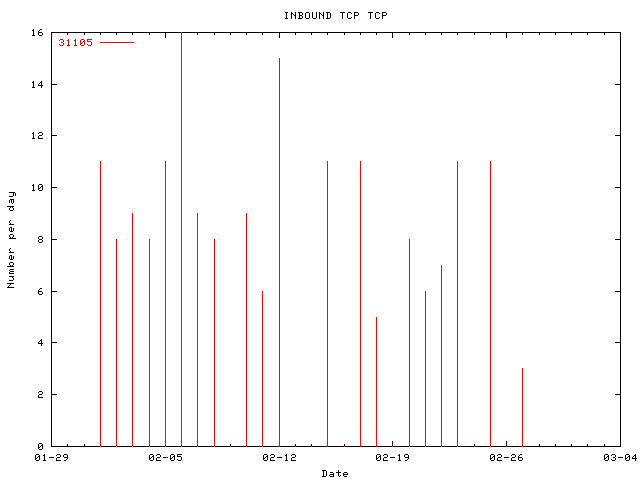
| 31105 | 183 | Timeline Trend: -1.53 | |
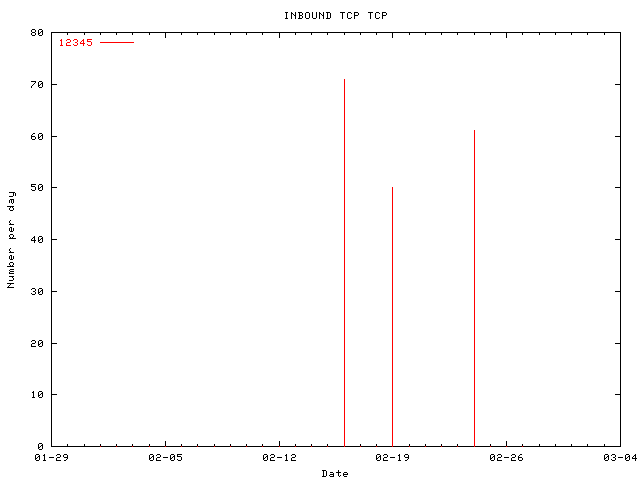
| 12345 | 182 | Timeline Trend: -14.14 | NetBus backdoor trojan or Trend Micro Office Scan |
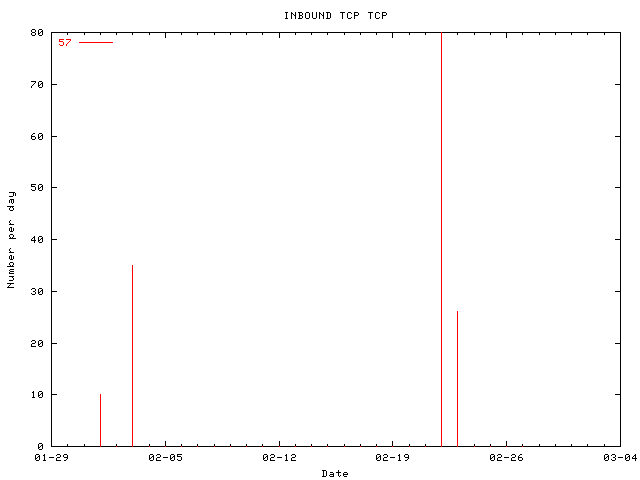
| 57 | 151 | Timeline Trend: -13.95 | |
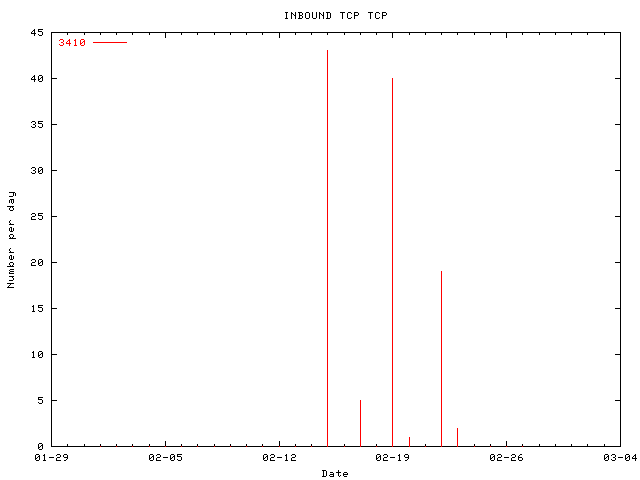
| 3410 | 110 | Timeline Trend: -13.64 | |
| 22(ssh) | 93 | Timeline Trend: -13.47 | |
| 455 | 83 | Timeline Trend: -13.35 | Dirt, Backdoor.SubSari15 trojan, 80.184.152.4 has scan for this port |
| 34816 | 82 | Timeline Trend: 1.91 | |
| Other | 890 |
| 137(netbios-ns) | 8692 | Timeline Trend: 0.60 | NETBIOS Name Service |
| 1434(ms-sql-m) | 5905 | Timeline Trend: -1.10 | Microsoft-SQL-Monitor, CA-2003-04 |
| 1026 | 2366 | Timeline Trend: -0.87 | |
| 135 | 1525 | Timeline Trend: -2.79 | DCE endpoint resolution |
| 1027 | 260 | Timeline Trend: -15.53 | |
| 1812(radius) | 146 | Timeline Trend: -0.04 | |
| 111(sunrpc) | 28 | Timeline Trend: -13.30 | |
| 31789 | 18 | Timeline Trend: -12.86 | |
| 53(domain) | 17 | Timeline Trend: -12.80 | |
| 1024 | 16 | Timeline Trend: -12.74 | |
| 500(isakmp) | 7 | Timeline Trend: -11.92 | |
| 1030 | 5 | Timeline Trend: -11.58 | |
| 28431 | 2 | Timeline Trend: -10.66 | |
| 666 | 2 | Timeline Trend: -10.66 | |
| 1028 | 1 | Timeline Trend: -9.97 | |
| 30072 | 1 | Timeline Trend: -9.97 | |
| 2726 | 1 | Timeline Trend: -9.97 | |
| 7428 | 1 | Timeline Trend: -9.97 | |
| 23561 | 1 | Timeline Trend: -9.97 |
There are only logs of ICMP echo-request (ping) and INBOUND ICMP is decreasing with time. Nachi/Welchia worm is slowly eradicated.
The main reconnaissance activity is port probe, they were looking for open port with known vulnerabilities like
Most scans are against only one port using sequential IP addresses:
There are few Nmap ICMP ping:
[kmaster@christophe sotm30_bis]$ grep ICMP honeynet-Feb1_FebXX.log|grep "LEN=28"| ./stat_by.pl "SRC="
SRC=203.69.14.162(203.69.14.162) count=47	ICMP only
SRC=217.81.50.100(pD9513264.dip.t-dialin.net) count=41, looking for TCP 445 (TCP 80 generated by Nmap, TCP 139 against a few host)
SRC=217.84.102.194(pD95466C2.dip.t-dialin.net) count=6	ICMP only
SRC=161.58.176.160(161.58.176.160) count=5	ping 11.11.11.75
SRC=203.125.225.247(203.125.225.247) count=1	ping 11.11.11.64
There is only one traceroute:
grep "TTL=1 " honeynet-Feb1_FebXX.log
Feb  3 13:43:51 bridge kernel: OUTG CONN OTHER: IN=br0 PHYSIN=eth1 OUT=br0 PHYSOUT=eth0 SRC=11.11.11.67 DST=224.0.0.2 LEN=32
TOS=0x00 PREC=0x00 TTL=1 ID=0 DF PROTO=2
Feb  3 13:45:06 bridge kernel: OUTG CONN OTHER: IN=br0 PHYSIN=eth1 OUT=br0 PHYSOUT=eth0 SRC=11.11.11.67 DST=224.0.1.1 LEN=32
TOS=0x00 PREC=0x00 TTL=1 ID=0 DF PROTO=2
Feb  3 13:45:11 bridge kernel: OUTG CONN OTHER: IN=br0 PHYSIN=eth1 OUT=br0 PHYSOUT=eth0 SRC=11.11.11.67 DST=224.0.1.1 LEN=32
TOS=0x00 PREC=0x00 TTL=1 ID=0 DF PROTO=2
Feb  3 13:45:11 bridge kernel: OUTG CONN OTHER: IN=br0 PHYSIN=eth1 OUT=br0 PHYSOUT=eth0 SRC=11.11.11.67 DST=224.0.1.1 LEN=32
TOS=0x00 PREC=0x00 TTL=1 ID=0 DF PROTO=2
Feb  8 11:02:10 bridge kernel: INBOUND ICMP: IN=br0 PHYSIN=eth0 OUT=br0 PHYSOUT=eth1 SRC=161.58.176.160 DST=11.11.11.75 LEN=28 TOS=0x00 PREC=0x00 TTL=1 ID=55782 PROTO=ICMP TYPE=8 CODE=0 ID=512 SEQ=19298
Feb  8 11:02:11 bridge kernel: INBOUND ICMP: IN=br0 PHYSIN=eth0 OUT=br0 PHYSOUT=eth1 SRC=161.58.176.160 DST=11.11.11.75 LEN=28 TOS=0x00 PREC=0x00 TTL=1 ID=55910 PROTO=ICMP TYPE=8 CODE=0 ID=512 SEQ=22370
Feb  8 11:02:13 bridge kernel: INBOUND ICMP: IN=br0 PHYSIN=eth0 OUT=br0 PHYSOUT=eth1 SRC=161.58.176.160 DST=11.11.11.75 LEN=28 TOS=0x00 PREC=0x00 TTL=1 ID=55966 PROTO=ICMP TYPE=8 CODE=0 ID=512 SEQ=25442
Feb 19 12:11:00 bridge kernel: OUTG CONN OTHER: IN=br0 PHYSIN=eth1 OUT=br0 PHYSOUT=eth0 SRC=11.11.11.67 DST=224.0.1.1 LEN=32
TOS=0x00 PREC=0x00 TTL=1 ID=0 DF PROTO=2
Feb 19 12:11:01 bridge kernel: OUTG CONN OTHER: IN=br0 PHYSIN=eth1 OUT=br0 PHYSOUT=eth0 SRC=11.11.11.67 DST=224.0.1.1 LEN=32
TOS=0x00 PREC=0x00 TTL=1 ID=0 DF PROTO=2
Feb 19 12:11:04 bridge kernel: OUTG CONN OTHER: IN=br0 PHYSIN=eth1 OUT=br0 PHYSOUT=eth0 SRC=11.11.11.67 DST=224.0.1.1 LEN=32
TOS=0x00 PREC=0x00 TTL=1 ID=0 DF PROTO=2
 |
|
Yes, there is what appear to be a slow scan. 63.126.133.117 is one of them:
 |
|
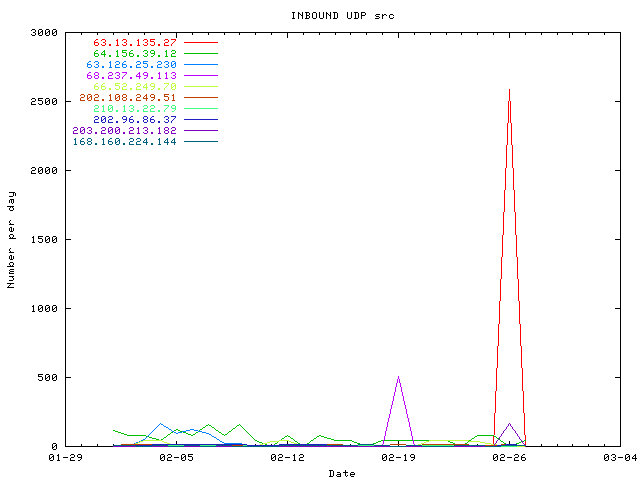
The same phenomena can be view with UDP. Let's take 64.156.39.12 who is scanning for UDP 135
[kmaster@christophe sotm30_bis]$ grep 64.156.39.12 honeynet-Feb1_FebXX.log|grep DPT=135|cut -d: -f1-2|uniq
Feb  1 10:07
Feb  1 10:09
Feb  1 22:41
Feb  2 02:36
Feb  2 05:48
Feb  3 04:28
Feb  3 15:01
Feb  4 09:23
Feb  5 00:27
Feb  5 03:09
Feb  5 22:10
Feb  6 07:39
Feb  6 08:02
Feb  7 00:33
Feb  7 10:03
Feb  7 10:24
Feb  7 22:47
...
I think it's also a worm on a fast link.
Internet Worms and automated exploit tools are the most common internet noise types.
There is traffic with private IP (RFC 1918), some examples: 10.10.228.18, 172.16.3.74, 192.168.0.1... IP spoofing has been used. Internet router has no ACL to filter private IP, the provider need to read RFC 3704 about Ingress Filtering for Multihomed Networks...
There is also a very unusual value: 127.0.0.1!
[kmaster@christophe sotm30_bis]$ grep 127.0.0.1 honeynet-Feb1_FebXX.log|head -3
Feb 16 08:08:09 bridge kernel: INBOUND TCP: IN=br0 PHYSIN=eth0 OUT=br0 PHYSOUT=eth1 SRC=127.0.0.1 DST=11.11.11.82 LEN=40 TOS=0x00 PREC=0x00 TTL=119 ID=21925 PROTO=TCP SPT=80 DPT=1537 WINDOW=0 RES=0x00 ACK RST URGP=0
Feb 16 08:08:22 bridge kernel: INBOUND TCP: IN=br0 PHYSIN=eth0 OUT=br0 PHYSOUT=eth1 SRC=127.0.0.1 DST=11.11.11.72 LEN=40 TOS=0x00 PREC=0x00 TTL=119 ID=23190 PROTO=TCP SPT=80 DPT=1866 WINDOW=0 RES=0x00 ACK RST URGP=0
Feb 16 08:08:34 bridge kernel: INBOUND TCP: IN=br0 PHYSIN=eth0 OUT=br0 PHYSOUT=eth1 SRC=127.0.0.1 DST=11.11.11.85 LEN=40 TOS=0x00 PREC=0x00 TTL=119 ID=24295 PROTO=TCP SPT=80 DPT=1271 WINDOW=0 RES=0x00 ACK RST URGP=0
It's TCP RST packet coming from the external interface.
Yes, there are outbound connection other than request for port auth/ident (TCP DPT=113).
To sumarize the results from
grep "OUTG CONN TCP" honeynet-Feb1_FebXX.log|grep SYN|grep -v "DPT=113":
Port 80
209.63.57.10	www1.0catch.com								Feb  7 16:28:50
62.211.66.12	Telecom Italia NET, http://www.xoom.it (members.xoom.virgilio.it)	Feb  8 06:52:55
207.66.155.21	Bondo and Remer BONDO-REMER (NET-207-66-155-16-1)			Feb  8 07:34:30
195.27.176.155	master.openssl.org							Feb  8 10:57:25

Port 21:
193.230.153.133	www.as.ro (maybe www.i-need-ftp.as.ro, www.lugojteam.as.ro)		Feb  8 07:14:07
209.63.57.10	www1.0catch.com								Feb  7 16:28:50
216.254.0.38	rpmfind.speakeasy.net							Feb  8 12:01:03
66.187.232.40	updates.redhat.com							Feb  8 12:15:14

Port 1291:
Port 1051:
Port 3184:
64.161.61.115	adsl-64-161-61-115.dsl.snlo01.pacbell.net				Feb  8 10:50:04
I think a FTP have been done and at least three files has been downloaded.
Xoom is known to be used by hacker, we already have seen its FTP used in SOTM29. 11.11.11.67 has try to contact master.openssl.org and updates.redhat.com, it should be a Linux RedHat system with an unpatched OpenSSL.
If you look at open ports list, you will see a lot of external hosts have been contacted for FTP, SSH, IRC, IRC via PsyBNC... A time line can found here.
Outbound connection logs are the more interesting data. If there are unusual outbound traffic like a lot of connexion rejected by the firewall from an inside interface (dmz or lan), you may have been hacked. A black hat or a worm in an internal lan is a highest treat.
Christophe GRENIER
Security Consultant
Global Secure
mail me personally or at work
Other high-level metrics about the data can be found here.
Internet Links:
ISC Incidents trends
DShield TOP Ports
w32.welchia.worm
Tech alert about MyDoom
CAN-2003-0605
CAN-2003-0528
CAN-2003-0352
eeye Advisorie about Windows RPC, RPC DCOM
CAN-2002-0656 about OpenSSL SSLv2 handshake bug
GenII Honeynet
SOTM29, the previous challenge