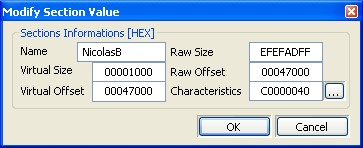
With this change made, the modified file loads cleanly in IdaPro.
One challenge faced by users of IdaPro when dealing with self modifying
code is that without running the program, it is difficult to observe
the changes the program would make to itself at runtime. One
means to overcome this limitation is to reverse engineer enough of the
program to understand how the self-modifying portion of the code
behaves and then create a script that will modify the Ida database in
the same way as if the program was actually running. This
requires time for both understanding the code and authoring/debugging
an IDC script. I prefer to make use of an alternate method which
makes use of an x86 instruction
emulator plugin
available for IdaPro. Using the plugin, a user can step through
instructions in the database. Any instructions that modify memory
locations represented by the database cause the emulator to interact
with and modify the database directly. By using this technique,
the program itself is used to modify the Ida database eliminating the
need to fully comprehend the program's actions and author a script to
carry out those actions.

Using the plugin and beginning at
the
start function, the
first anti-reverse engineering measure encountered is the use of
Windows exceptions to perform some interesting register
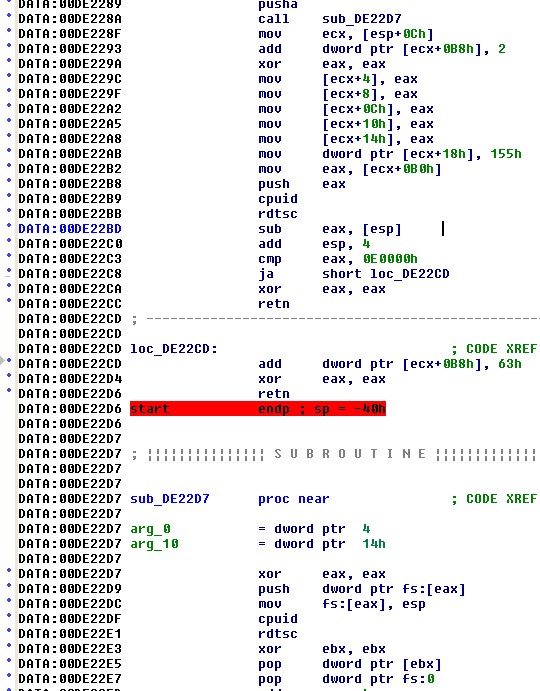
manipulations. The code listing to the right shows the calling of
a subroutine named
sub_DE22D7.
At the call, the return address 0xDE228F is placed in the stack and
becomes part of the exception handler configured in the first 3 lines
of
sub_DE22D7. The
subroutine utilizes the
rdtsc
instruction to read the CPU's time stamp counter just prior to
generating an exception with a null pointer dereference at
0xDE22E5. This causes a memory access violation exception to be
generated and control transfers to the exception handler at 0xDE228F.
By accessing the passed CONTEXT data structure the handler zeroizes all
of the CPU's debug registers (0xDE229C-0xDE22A8) which has the effect
of zeroing out any breakpoints specified in those registers. At
location 0xDE22B2, the handler retrieves the saved time stamp counter
before invoking
rdtsc a
second time to get the current time stamp. The comparison at
location 0xDE22C3 is a check to see whether the time stamp has
incremented by an unusually large amount which will be the case if the
program has been suspended by a debugger. In such a case, action
is taken to modify the saved eip before returning from the exception
(this results in the program crashing eventually).
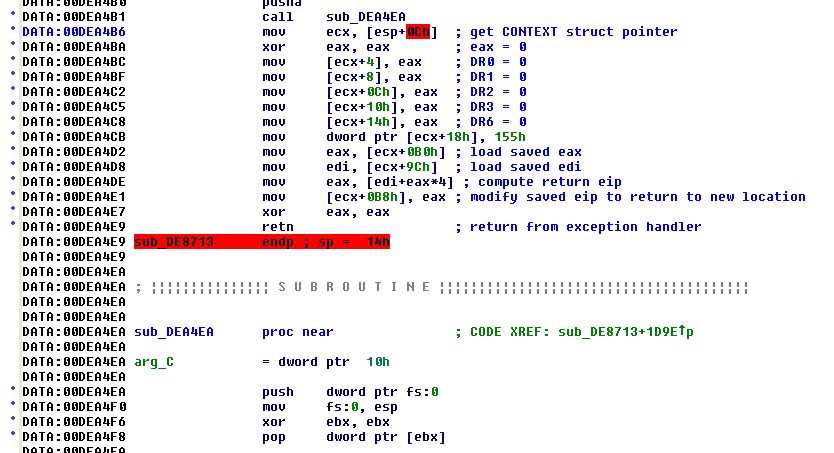
The program runs through a number of similar exception cycles before
entering the first of 178 xor decoding loops which wrap the program
being program being protected like the layers of an onion. The
problem with running code like this in a debugger is when and where to
stop. It is difficult to choose a location to set a breakpoint
because with self modifying coded you can never be sure that a
particular location will be reached. Additionally, placing an
int 3 breakpoint is next to
impossible because the value (0xCC) may be modified by a decoding loop
before it is hit. After unwrapping several of these layers using
the emulator plugin, a pattern began to emerge. Each layer that
was decoded contained yet another decoder to decode yet another inner
layer, and the same algorithm was used by each decoding layer.
The major question was "how deep do these layers go?"
In order to fully automate the process of getting past these onion
layers I developed an IDC script named
unroll_all.idc
to handle all of the unrolling. The first version of the script was
designed to decode successive layers until a failure occurred, then
report the number of layers successfully decoded. That number was
used as a loop termination condition in the final version of the
script. The layers were so deep and the amount of data being
xored so much (about 256k bytes per pass) that the script took 15
minutes to execute. The script actually handled 172 of the layers
at which point something changed that caused it to fail. The
emulator was used to get past the final 3 layers. When an
obfuscated binary has been completely decoded, it is often posible to
view strings that failed to appear initially. For this reason I
ran strings ono the binary once again (using the IdaPro strings
facility) but unfortunately, noted no new strings.
Following the last decoding loop, the program transfers to location
0x00DE8653 (Which I dubbed VM_Setup, see
Note 1)
where two exception/exception
handling blocks are executed in quick succession before control jumps
across a block of six dword variables to location 0x00DE874E (which I
dubbed VM_Entry).
From this point on, the code takes on a bit of a different style.
The six dword memory locations starting at 0x00DE8736 are initialized
with successive four byte chunks of the following string:
"Evil Has No Boundaries !"


 Using the plugin and beginning at
the start function, the
first anti-reverse engineering measure encountered is the use of
Windows exceptions to perform some interesting register
manipulations. The code listing to the right shows the calling of
a subroutine named sub_DE22D7.
At the call, the return address 0xDE228F is placed in the stack and
becomes part of the exception handler configured in the first 3 lines
of sub_DE22D7. The
subroutine utilizes the rdtsc
instruction to read the CPU's time stamp counter just prior to
generating an exception with a null pointer dereference at
0xDE22E5. This causes a memory access violation exception to be
generated and control transfers to the exception handler at 0xDE228F.
By accessing the passed CONTEXT data structure the handler zeroizes all
of the CPU's debug registers (0xDE229C-0xDE22A8) which has the effect
of zeroing out any breakpoints specified in those registers. At
location 0xDE22B2, the handler retrieves the saved time stamp counter
before invoking rdtsc a
second time to get the current time stamp. The comparison at
location 0xDE22C3 is a check to see whether the time stamp has
incremented by an unusually large amount which will be the case if the
program has been suspended by a debugger. In such a case, action
is taken to modify the saved eip before returning from the exception
(this results in the program crashing eventually).